Last updated ·Published ·By the WiserWork team
BMI Calculator
Calculate your Body Mass Index & get health insights
Find your height and weight below to see your BMI at a glance, in both metric and imperial units.
Body mass index is a single number that compares your weight with your height. It has been in use for well over a century and is still the first figure most health services reach for, not because it is precise but because it needs nothing more than scales and a tape measure. This calculator works out your BMI from metric or imperial measurements, shows where it falls on the standard scale, and tells you the weight range that would put you in the healthy band at your height.
What BMI actually measures
BMI is your weight in kilograms divided by the square of your height in metres. That is the whole formula. It does not measure body fat, muscle, bone density or where fat sits on your body. It measures how heavy you are relative to how tall you are, and treats that ratio as a rough proxy for whether your weight is worth a conversation with a clinician.
The index was devised by the Belgian mathematician Adolphe Quetelet in the 1830s, and the name "body mass index" came into use after Ancel Keys and colleagues compared several relative-weight measures in 1972. It was built to describe populations, which is worth remembering when you apply it to one person.
How this calculator gets your number
In metric mode the tool divides your centimetre height by 100 and applies the formula. In imperial mode it converts first: feet and inches are combined and multiplied by 0.0254 for metres, and pounds by 0.453592 for kilograms. The arithmetic underneath is identical either way. The result is then placed in one of six bands:
- Below 18.5 – underweight
- 18.5 to 24.9 – normal or healthy weight
- 25.0 to 29.9 – overweight
- 30.0 to 34.9 – obese, class I
- 35.0 to 39.9 – obese, class II
- 40.0 and above – obese, class III
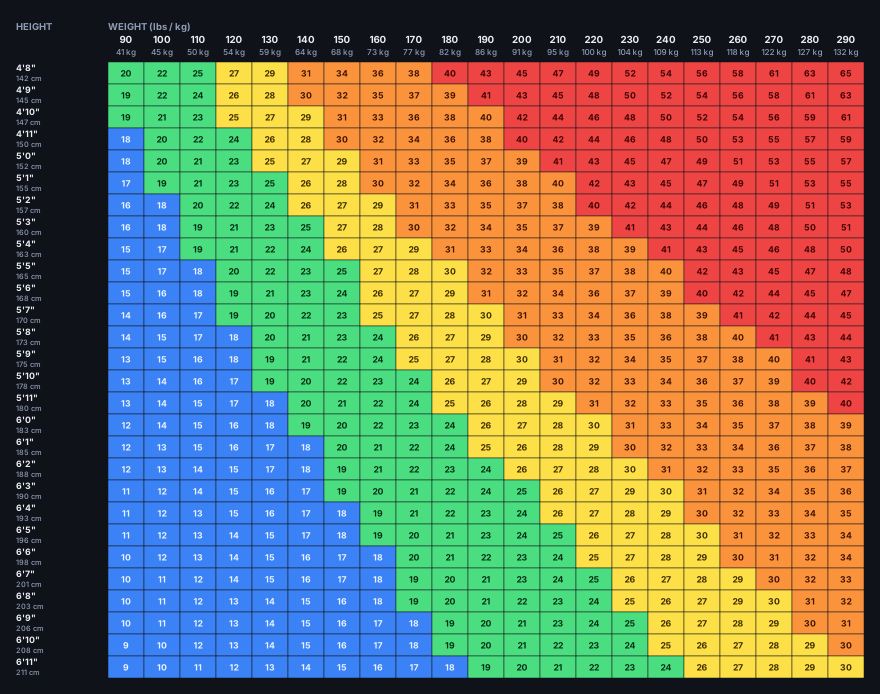
These are the World Health Organization's classifications for adults, also used by the NHS, the CDC and most national health services. The coloured bar spreads BMI 10 to 45 across its width, so the marker shows how close you are to the neighbouring bands rather than only which box you land in. A BMI of 24.8 and a BMI of 25.2 sit either side of a line but describe almost the same body.
The three supporting figures
- Healthy weight range runs the formula backwards, multiplying 18.5 and 24.9 by your height squared. It is shown in whichever units you selected, and it is usually the more useful output because it is expressed in something you can act on.
- Ponderal index divides weight by height cubed rather than squared. Because it scales with volume instead of area it varies less with height, making it steadier for people who are unusually tall or short. It has no agreed categories, so treat it as context.
- Estimated BMR is a rough resting-metabolism figure from the Mifflin-St Jeor equation. Note the simplification: this page has no age or sex input, so it assumes a 25 year old male. If that does not describe you the number will be off, sometimes by several hundred calories. The Calorie Calculator asks for age and sex and gives a figure you can work from.
Where BMI falls down
BMI cannot tell dense tissue from fat. A heavily muscled athlete and a sedentary person of the same height and weight get an identical score, and the label fits only one of them. The reverse happens too: someone can sit inside the normal band while carrying a high proportion of fat and little muscle. Other limits are worth knowing:
- It ignores fat distribution. Where you carry weight, particularly around the waist, is generally considered more informative than total mass alone.
- The adult cut-offs do not apply to under-18s. Growing bodies are assessed against age and sex percentile charts, which is what the BMI for Kids Calculator does.
- It was not built for pregnancy, or for conditions that alter body composition or fluid balance.
- The bands came largely from European-descent populations. Some health bodies recommend lower thresholds for people of South Asian, Chinese and other Asian backgrounds, so a result near a boundary may mean something different depending on your ancestry.
The common mistake is treating the number as a diagnosis rather than a screening figure. If body composition is what you are after, the Body Fat Calculator estimates fat percentage from circumference measurements.
How to use the BMI Calculator
- Choose Metric (cm / kg) or Imperial (ft/in / lbs) using the toggle at the top of the measurements card.
- Enter your height. In imperial mode this is two fields, feet and inches, filled in separately.
- Enter your weight, ideally weighing yourself at a consistent time of day, since weight swings within a single day.
- Read the BMI figure, its category and the marker position on the coloured scale. It recalculates as you type.
- Check the healthy weight range for your height, then scan the reference chart lower down the page.
Frequently Asked Questions
What is a good BMI?
For most adults the healthy band runs from 18.5 to 24.9. A single number cannot account for muscle mass, body shape, age or ancestry, so a result just outside the band is a prompt to look further rather than a problem in itself.
Why does the calculator show a BMR when it never asks my age or sex?
Because it fills in defaults. The BMR figure applies the Mifflin-St Jeor equation assuming a 25 year old male, since this page collects only height and weight. Treat it as a ballpark.
Does BMI work for athletes and very muscular people?
Not reliably. Muscle is denser than fat, so people with substantial muscle mass often score in the overweight or obese range while carrying little excess fat. This is the best-known weakness of the index.
Can I use this for my child?
No. Children's and teenagers' BMI is read against growth charts that account for age and sex, because normal body composition changes rapidly during development. The adult categories here would mislead.
Is anything I enter sent anywhere?
No. The calculation runs entirely in your browser using JavaScript on this page. Your height and weight are never transmitted to a server, and nothing is saved between visits.
Sources
- World Health Organization – classification of adult BMI, including the 18.5, 25, 30, 35 and 40 cut-off points.
- Adolphe Quetelet – the Quetelet index, weight divided by height squared, introduced in the 1830s.
- Ancel Keys and colleagues (1972) – "Indices of relative weight and obesity", which popularised the term body mass index.
- Mifflin, St Jeor and colleagues (1990) – predictive equation for resting energy expenditure, used for the estimated BMR.